To demonstrate Markowitz Method we will assign some tasks and answer them step by step, morover you can find an excel file with formulas and all calculations at the bottom of this article.
Collect daily data for your stocks from https://quantquote.com/historical-stock-data Free Data tab.
Assignment 1. (5 points)
Collect data for last four years (ending in 2013). Identify risk free rate.
Calculate monthly returns for each of the stocks in the portfolio.
Calculate the mean monthly return for each stock.

Assignment 2. (5 points)
Build variance covariance matrix for the portfolio. State the method used.
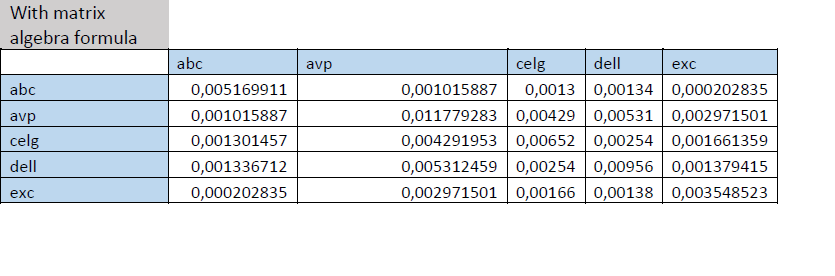
I calculated covariance matrix with two methods: Data analysis tool pack and matrix algebra formula. They differ a little bit, because data analysis use arithmetic mean by default. You can find calculations in the exccel file I mentioned above.
Assignment 3. (5 points)
Build Market Return Portfolio using Z-vector. Calculate z-vector, x-vector, ERP and SDev.

Assignment 4. (10 points)
Build 2 (A and B) Minimum Global Return Portfolios using Z-vector. Calculate z-vector, x-vector, ERP and SDev for each.

Assignment 5. (15 points)
Build an Efficient Frontier chart by plotting combinations of MV portfolios above.
Build a Capital Market Line by using data from efficient frontier calculations.

We can see on the chart the market portfolio, which is a point where CML touches the efficient frontier and coordinates are (0.1229; 0.486). The Y coordinate is a return and the X is a risk.
The leftist point on Frontier shows the first optimal portfolio with the least risk which is called minimum variance portfolio, as we go down-right we have points which offer less return with the same risk as if we would movie up-right. So, from the leftist point to right-up we have our efficient portfolios which shoes us the high return higher risk relation. Then we can see also RFR on the graph and the CML, which has the same sharp ratio in every point. It shows the ratio of portfolio invested in Treasury bill and market portfolio as we move on that line. Market portfolio with a 0,12 standard deviation (risk) and 4,8% return consists of 40% a and 60% b stocks. I highlighted it in excel with yellow. I also highlighted case when we take 100% a 0% b with blue (more risky more return) and 0% a 100% b with red(less risky less return).
From first assignment, I got five stocks average monthly market returns from which two are negative and three are positive. This suggests shorting negative ones and buying positive ones.
In third assignment, I got market return portfolio which has a positive expected return, and then I calculated worst and best scenario portfolios in order to construct efficient frontier by applying different proportions to them.
Then I calculated Efficient frontier and CML which suggests to buy 40% stock a and 60% stock b as I interpreted above.
Then I calculated sharp ratios for market portfolio and two neighboring points on frontier to make sure that it has the highest ratio.
The numbers are: Sharpe for market portfolio 0,3914, for one point right 0,3195 for one point left 0,3125. So, we can see that frontier market portfolio offers the highest return on one unit of risk.
Link to exccel file Excel.